

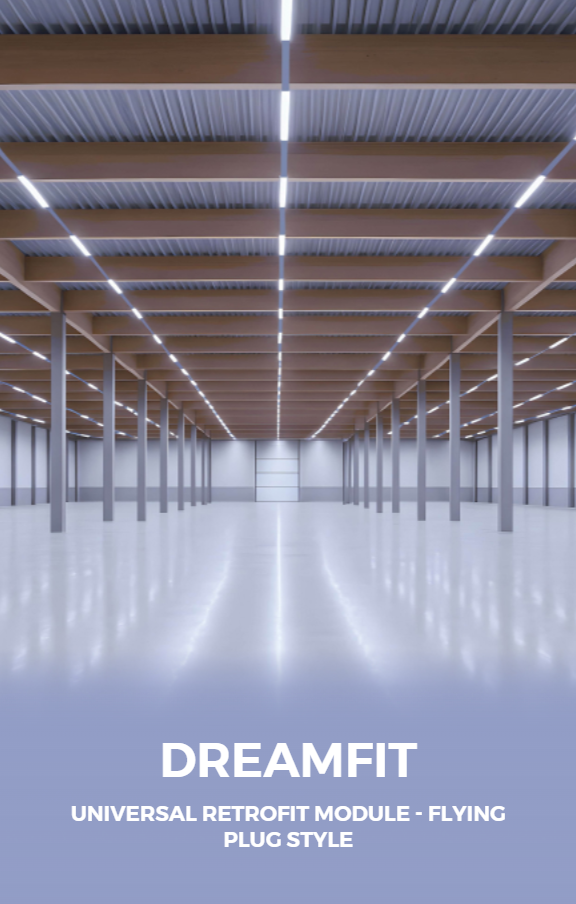
Data snapshot and decision rule
Start with measurable outcomes: target a net operating cost reduction, a minimum illuminance and a predictable payback window. A focused data-driven plan uses energy use per square foot, maintenance labor hours saved, and a disruption cost estimate to decide scope. For linear distribution aisles, specify led light trunking in the design when modular replacement and fast reconfiguration matter. I recommend establishing a single decision rule up front—if forecasted annual savings cover capital and disruption within 24–36 months, proceed. That rule aligns capital discipline with operational tolerance for downtime and sets a clear KPI for approvals.
Budget components and the model to run
Break costs into four line items and quantify each:- Hardware: fixture cost per bay, drivers, mounting/trunking.- Installation: crew-hours, lift rental, electrician overtime.- Operational interruption: lost throughput or re-routing costs during work.- Lifecycle savings: annual energy and maintenance reductions.Run a simple model: Total Cost = Hardware + Installation + Interruption; Annual Benefit = Energy Savings + Maintenance Savings. Compute Payback = Total Cost / Annual Benefit. Use conservative assumptions: LED energy savings 30–60% vs HID is typical; expect fixture life 50,000–100,000 hours. Stress-test with a 20% higher installation cost and a 10% lower energy price to see sensitivity. That yields a defensible investment case for stakeholders.
Performance metrics that drive value
Ask for measured specifications, not marketing claims:- Delivered lux at task plane and uniformity ratio (min:avg).- Luminaire efficacy (lm/W) and system-level lumen maintenance (L80 at hours).- Color temperature and CRI appropriate to tasks (e.g., 4000K, CRI ≥ 70 for warehouses).- Flicker percentage, driver MTBF, IP rating, and thermal management data.Select products validated on photometric reports and site modeling. For warehouse deployments, compare how solutions perform in aisle geometry; many buyers choose industrial led lights for warehouse that publish aisle-specific distributions and lumen outputs to avoid under- or over-lighting.
Disruption, scheduling and real-world anchor
Minimize revenue impact by matching installation strategy to throughput constraints:- Night shifts for twenty-four/seven operations.- Zoned daytime rollouts with temporary lighting for high-throughput areas.- Full shutdown windows only when sequential work is faster overall.A recent 60,000 sq ft Chicago warehouse retrofit showed staggered overnight installs reduced interruption costs by roughly half compared with daytime shutdowns because order processing never stopped for more than a single aisle. Use on-paper crew productivity rates and verify with a pilot run to refine the schedule.
Risk checklist and common mistakes
Avoid decisions made on sticker price alone. Typical errors:- Underestimating mounting and control integration costs.- Accepting quoted fixture lumen output without confirming delivered lux in the space.- Ignoring thermal constraints that shorten driver life.- Failing to plan spare-part inventory for non-standard drivers.Mitigations: require photometric simulations, demand thermal test data, include spare-driver and warranty terms in the contract, and price a contingency line (5–10%) for unforeseen coordination work.
Configuration choices and control strategy
Decide where to spend for the best marginal returns:- Trunking or integrated linear systems reduce install time and future reconfiguration costs.- Zoned dimming and occupancy controls cut run-hours; tie controls to facility management systems when possible.- Standardize on a small set of fixture types to simplify inventory and replacement.Compare scenarios: a higher-capex trunking system often lowers installation hours by 20–40% and simplifies future layout changes, shortening subsequent retrofit timelines and lowering total cost of ownership.
Measurement and vendor evaluation
Set contract KPIs: verified post-install lux, measured energy consumption for the metered month, and documented warranty response times. Require vendors to provide sample installations or client references with similar scale. Evaluate long-term supplier reliability by checking warranty claim handling and available local service. Quantify vendor risk into the model as a small probability of early failure multiplied by replacement cost.
Final synthesis
Decide with data: a retrofit that meets your payback rule, preserves throughput, and specifies measurable deliverables will succeed. Specify trunking and control strategies that reduce labor and rework. For projects where predictable capital deployment and reliable hardware matter most, choose suppliers whose systems simplify installation and meet the documented performance metrics—an approach that often leads teams to solutions from trieco.