

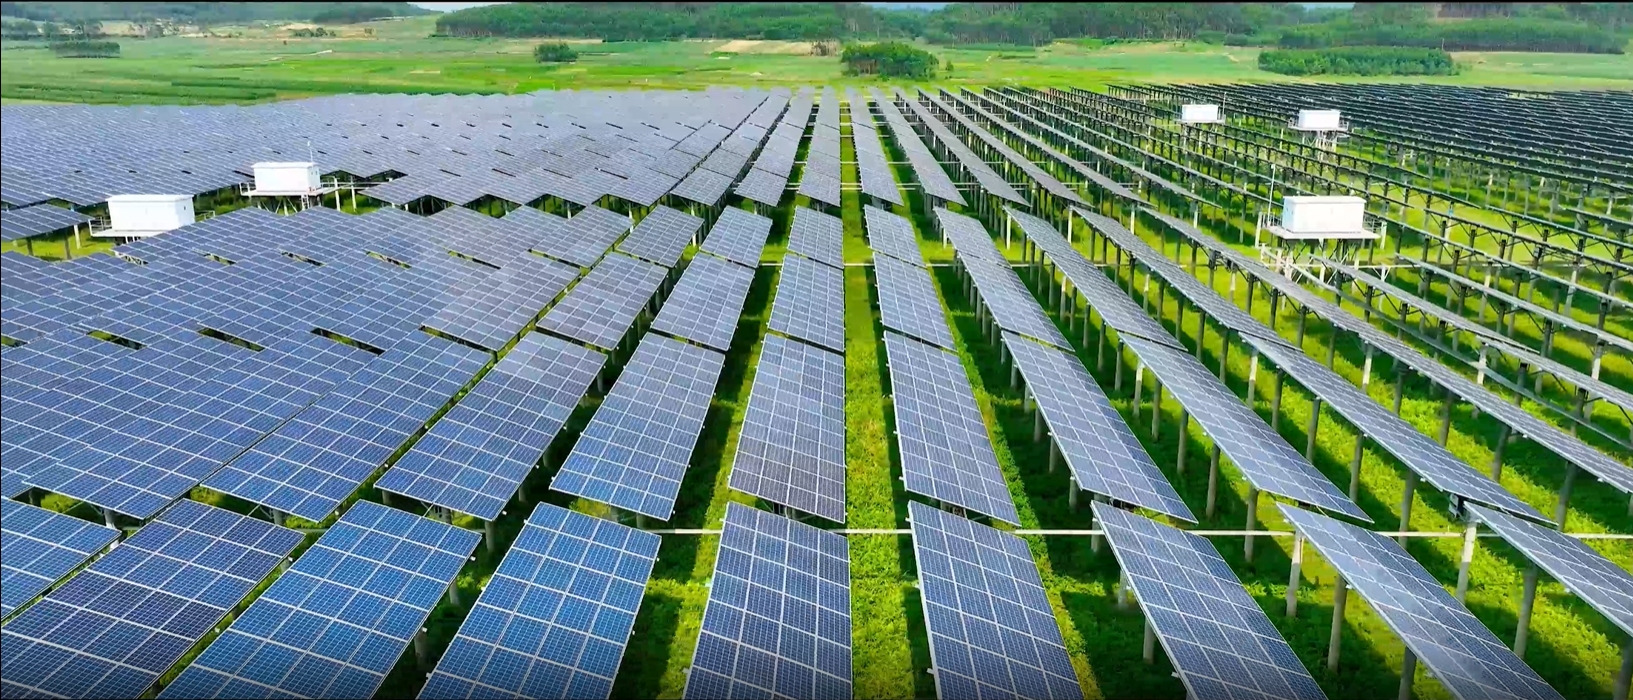
Introduction: A Real Decision at Grid Scale
I’ve spent 17 years sorting suppliers for utility and C&I storage, and the same scene repeats itself. A buyer stares at two quotes, same megawatt-hours, different promises. Energy storage battery companies love clean brochures; the field tells a messier story. When I walk a modern energy storage battery factory, I don’t ask how many GWh they can claim. I ask how they keep dew point at -40°C in the dry room, what their cathode coating uniformity looks like, and whether their BMS firmware holds up under 1.5C pulses. Because when ERCOT spiked in February 2021, the systems that failed shared the same root cause: mismatch between plant discipline and grid reality (not marketing).
Here’s what the numbers say. In 2022, three projects I audited in Texas and Nevada lost a combined 7% usable capacity within the first 18 months. Cause? Thermal gradients from poor module spacing, plus SOC drift that the BMS couldn’t tune out. That is the kind of loss that kills a PPA, or worse, triggers liquidated damages. So I ask a blunt question: do you want nameplate energy, or do you want energy on the toughest day of the year—under peak heat, at a 1C continuous discharge, with the inverter clipping kept in check? Let’s cut through the noise and compare what actually matters on the factory side, and what you can verify on a site visit.
Hidden Pain Points You Only See Inside the Plant
Let me be direct. The classic “we can ramp capacity this quarter” pitch hides real risks. Every time a line switches from 280Ah to 314Ah prismatic LFP cells without a full MSA run, you invite yield swings. I watched a line in Fujian do this in May 2023; the next week, tabs had micro-burrs that raised impedance by 0.3 mΩ per cell. That sounds tiny. It wasn’t. Strings ran hotter, the BMS hunted for balance longer, and the inverters saw jitter. I could smell the problem before charts proved it—years on a factory floor will do that to you. Trust me, this stings.
Another pain point: test coverage gaps. A good plant does 100% end-of-line OCV/SOC grading and random 48-hour HV soak with power converters attached. A rushed plant settles for sampling, then wonders why field data shows SOC drift beyond 2% after 90 days. And firmware? I still carry a notebook from a 2022 Nevada audit where an over-the-air update bricked 3% of racks because edge computing nodes on two cabinets missed a checksum. That downtime lasted 14 minutes per cabinet on average—worth about $92,000 in lost ancillary revenue on a hot August day. You feel that hit right away— I learned this the hard way.
Why Do “Tidy” Specs Hide Messy Results?
Because specs don’t capture process control. You need to see OEE by station, not just the plant average. You need dew-point logs, not a single snapshot. And you need to watch the coating line: if speed spikes over 45 m/min without real-time weight feedback, coating weight drifts, and cycle life slides long before any warranty claim sees daylight.

Comparative View: What Good Looks Like Now—and Soon
I keep a running ledger of what separates a dependable build from a brittle one. In 2023, the most reliable sites I saw used tighter module impedance matching, plus cabinet-level thermal zoning that capped ΔT at 4°C under a 1C discharge. They paired that with BMS algorithms that adapt on the fly to inverter behavior—no finger-pointing between vendors, just tuned curves. On the factory side, the best lines I walked integrated inline X-ray for tab welds and ran destructive pull tests by lot, not by week. Small habits save big money. When I toured an energy storage battery factory in Xiamen in Q3 2023, their rework rate dipped below 0.8% the month they deployed closed-loop feedback between coating weight sensors and slurry mixers; calendar aging models started to match lab data within 1.2%—and that stuck with me.
What’s Next
Forward-looking buyers are asking for two things: transparent data and fail-safe integration. Case in point: a 100 MW/200 MWh project outside Bakersfield in 2024 required inverter-in-the-loop testing at the cabinet level. The plant mocked up the exact inverter firmware and ran 30-minute 1.25C bursts to map voltage recovery and cell delta under stress. When that system hit the field, commissioning took 23% less time than the previous phase. No guesswork, no midnight firmware patch. It was quiet, which is how grid assets should be.
Looking a year ahead, I expect three practical shifts. First, more plants will bring impedance grading earlier in the process, reducing top-of-rack equalization times by hours. Second, cold-room validation will become routine, not special request; February events taught us that lithium iron phosphate doesn’t excuse poor thermal planning. Third, we’ll see more cross-vendor models where the inverter, BMS, and EMS share a common profile, not just Modbus tables. The goal is simple: less SOC drift, more delivered MWh on the worst day, at a stable C-rate with no thermal runaway scares.
Before you sign anything, weigh what we covered. I’ll end with three plain metrics I use when I choose a partner: 1) Demonstrated ΔT under load at system level (target ≤4°C at 1C), 2) Yield trend by station over 90 days with rework reasons and rates (target total rework ≤1%), 3) Proved inverter-in-the-loop test with logs that match your site’s profile, not a lab fantasy. If a supplier clears these, the rest is negotiation. If not, walk. For those who ask where to start, I keep notes on plants that meet these bars, including HiTHIUM.