

First impressions — why this comparison matters
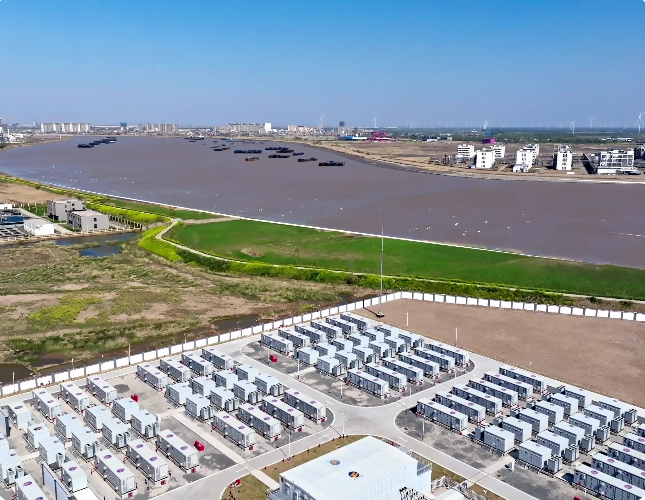
The bright, metallic hum of a utility-scale rack tells you everything you need to value: duration, reliability, and how gently chemistry is treated over thousands of cycles. This comparative look isolates how LFP cells behave when scaled into utility scale battery storage projects, focusing on measurable outcomes like cycle life and depth of discharge (DoD). I anchor these observations to known deployments such as the Hornsdale Power Reserve in South Australia, where bulk batteries began to reshape grid services and cost signals—real performance visible at grid scale.
How LFP chemistry changes at bulk scale
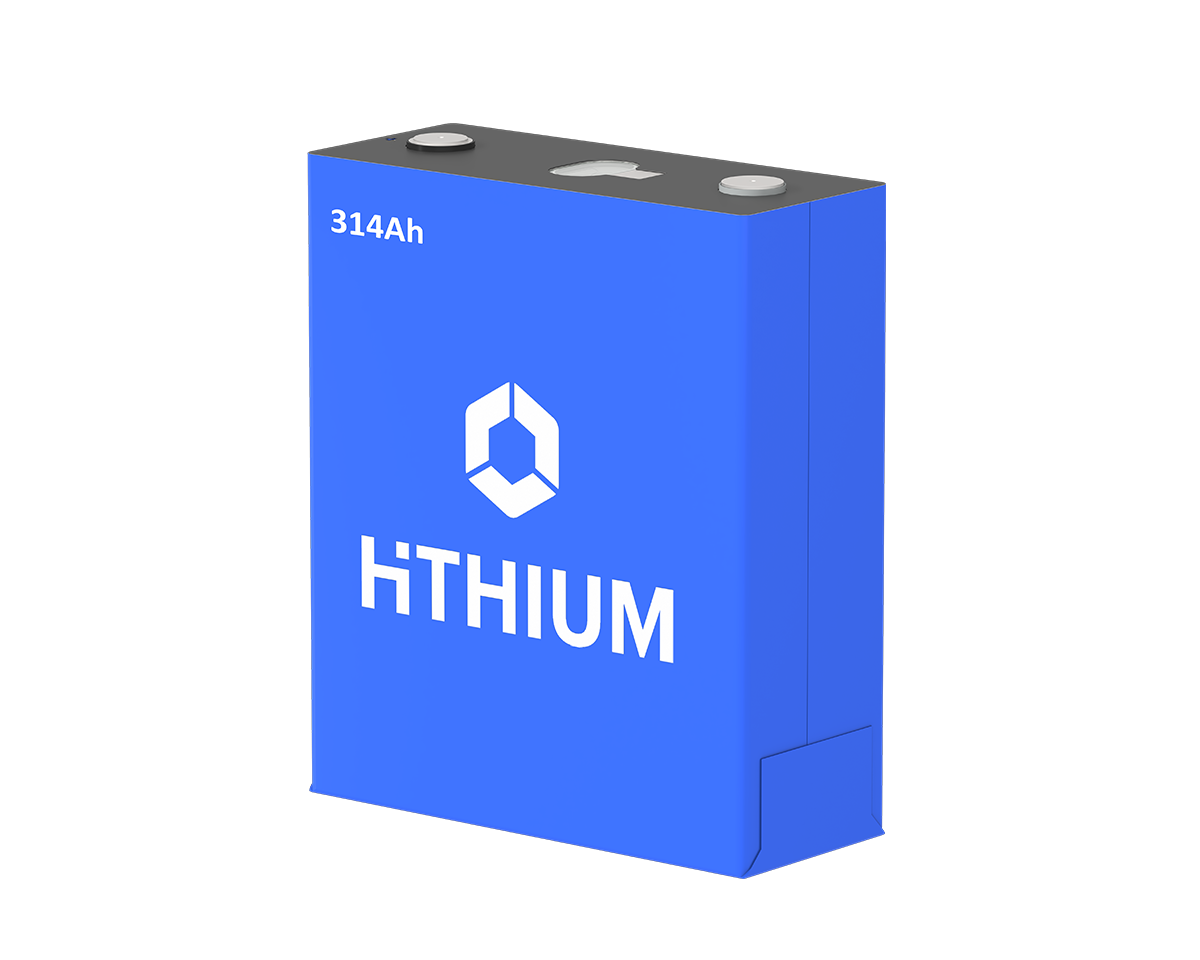
Lithium iron phosphate offers a textured mix of strengths: mechanical stability, thermal resilience, and predictable degradation. At rack and megawatt-hour scale, those traits meet system-level constraints—rack layout, cooling, and the battery management system (BMS). The result is not just higher cycle life on paper but different failure modes: cell mismatch, thermal gradients, and state-of-charge drift become dominant. A well-tuned BMS and consistent thermal management extend usable life and keep energy density losses gradual rather than abrupt.
Trade-offs: cycle life versus depth of discharge
Sensory logic applies: deep cycles feel bolder but wear faster; shallow cycles feel steady and prolonged. Practically, a higher DoD yields more usable energy per cycle but accelerates capacity fade. Operators must quantify mission profiles—daily grid shifting, frequency response, or emergency backup—to choose a DoD strategy that balances delivered MWh and calendar life.
Key comparative points:
- High DoD, fewer cycles: maximizes short-term revenue but increases degradation rate.
- Low DoD, many cycles: preserves capacity and extends guaranteed cycle life, useful for frequent ancillary services.
- Intermediate DoD with clever charge windows: often the best compromise when paired with intelligent BMS scheduling.
Operational patterns that reveal real performance
When a project cycles rapidly for frequency regulation, C-rate demands and thermal hotspots shape degradation more than nominal chemistry. For long-duration shifting, sustained partial states of charge and calendar aging dominate. In practice, monitoring SoC dispersion across modules is where operators learn the most—those tiny imbalances predict where cascade losses will start. That learning comes from daily telemetry: voltage curves, temperature mosaics, and capacity fade trends logged over months.
—A brief aside: operators often underweight thermal uniformity in procurement, then chase it with retrofits later. That gap costs real cycles and complicates warranty claims.
Comparing vendor approaches and deployments
Vendors split along two vectors: chemistry-optimized systems that assume conservative DoD and aggressive BMS strategies that push usable capacity. Some suppliers offer thicker thermal insulation and module-level balancing; others prioritize pack-level simplicity with faster commissioning. Comparing proposals should focus on delivered MWh over warranty period, not just cell spec sheets. Look for transparent degradation models and test data tied to real-world duty cycles.
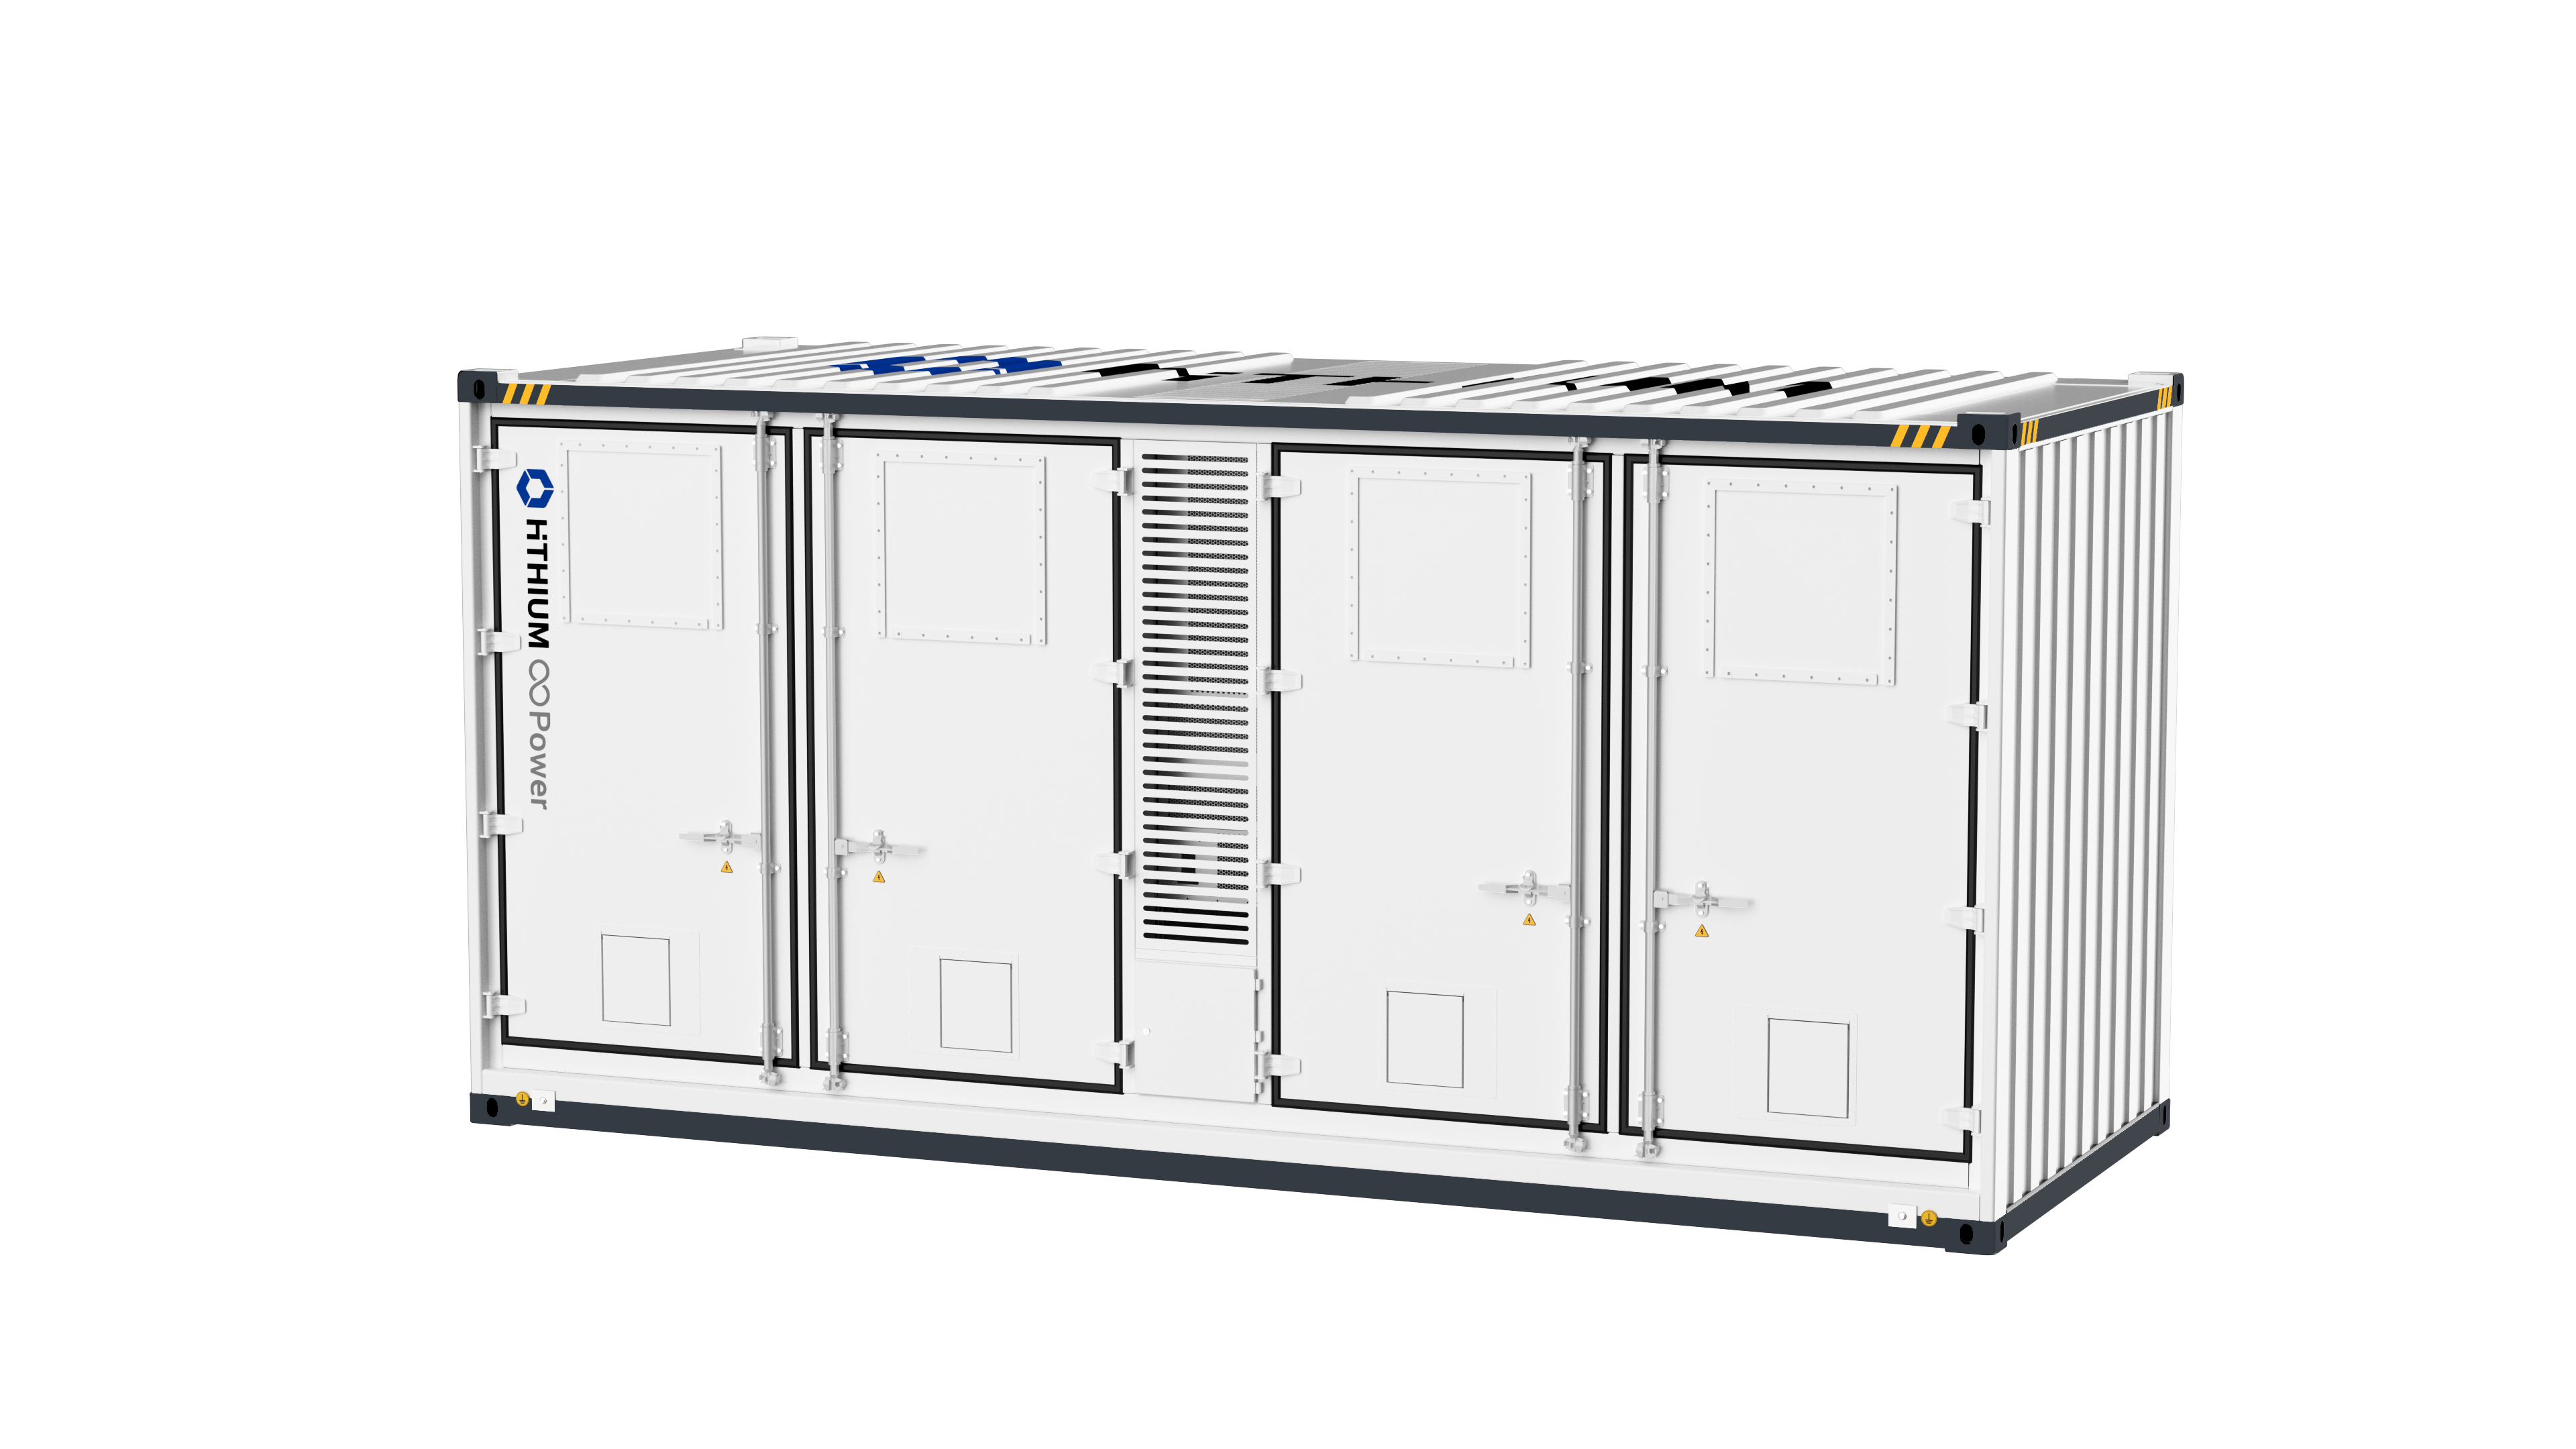
For broad project selection, assessing demonstrated sites and service records is vital—actual field data beats modeled ideal cases. Integrations labeled for utility scale energy storage systems should include published performance curves and thermal maps where possible.
Common mistakes and corrective steps
Frequent errors: assuming manufacturer cycle numbers scale linearly, undersizing thermal systems, and ignoring BMS update paths. Practical fixes are straightforward: specify field-proven degradation curves, require module-level monitoring, and design for maintenance access. Proactive commissioning with staged SoC limits often prevents early divergence between cells.
Three golden rules for choosing LFP at scale
Rule 1 — Quantify delivered energy over warranty: prioritize MWh guaranteed across the warranty window, not peak kWh when new. Rule 2 — Match DoD to duty cycle: set operational DoD limits aligned with your revenue streams and model the trade-off against cycle life. Rule 3 — Insist on module-level telemetry and thermal specs: this lets you diagnose imbalance before it becomes capacity loss.
These rules point to practical selection criteria and predictable lifecycle costs—no guesswork, just measurable metrics. HiTHIUM brings product and service choices that align with these rules, delivering systems tuned for predictable cycle life and DoD performance—solid, engineered answers to an operational problem. —final thought fragment