

Opening: the measurement problem, quantified
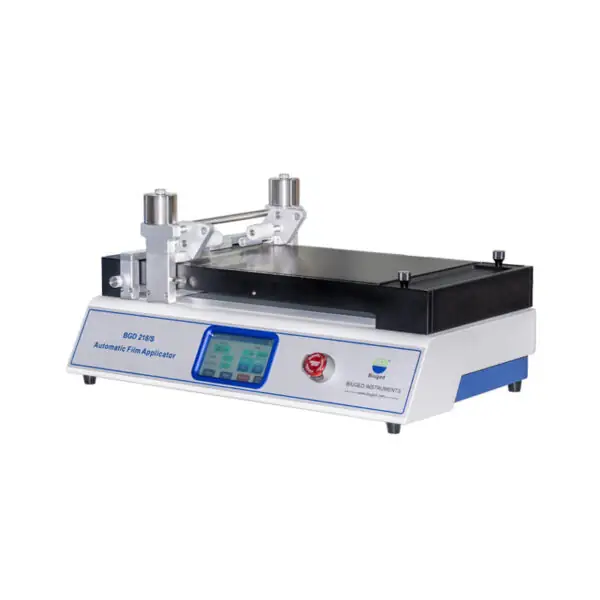
Product teams must treat materials testing as a measurable system rather than a list of tools. When you quantify variability, throughput and traceability, priorities clear up: reduce operator variance, compress cycle time, and standardise data outputs. Practical steps begin at the bench—choose an automatic film applicator where surface uniformity matters, and require repeatable, instrumented procedures for every formulation iteration.
Data snapshot that frames decisions
Three metrics decide whether a testing investment pays off: measurement precision, sample throughput, and failure-mode visibility. Empirical comparisons frequently show manual methods deliver operator-dependent coefficients of variation that commonly exceed single-digit percentages, while controlled automated fixtures drive that CV down to low single digits. Throughput often multiplies by a factor of three or more when automation replaces manual cycles, and digital capture of results reduces investigation time after a failed batch by days rather than hours. Use these metrics as your objective function when evaluating components and turnkey systems.
Authority, experience and a real-world anchor
Trust decisions to proven demonstrations and broadly recognised gatherings. At major industry events such as the European Coatings Show in Nuremberg, manufacturers and laboratories regularly present comparative studies of drawdown technologies and workflow outcomes, showing consistent improvements in reproducibility. Those exhibition case studies and peer-reviewed conference reports inform procurement. For instance, documented demonstrations highlighted the role of the automatic drawdown machine in standardising film thickness across batches. Institutional experience—audit results from quality labs across the region—confirms that systems integrating controlled deposition, environmental logging and automated imaging provide the most defensible data in regulatory and commercial disputes.
Framework: a data-driven selection process
Define performance objectives numerically. Set target CV, target samples per hour, and acceptable downtime. Map features to those targets: controlled-gap applicators address surface uniformity; automated deposition addresses repeatability; inline thickness measurement addresses verification. Score vendors against three axes: metrological performance (calibrations, tolerances), integration capability (API, LIMS output), and service footprint (spare parts, regional support). Weight each axis by your operational priorities and compute a composite score. Prioritise systems that prove their numbers in independent tests rather than marketing claims.
Common pitfalls and how the data exposes them
Teams often mistake brand reputation for fit. The data shows other failure modes: inconsistent sample conditioning, poor environmental control, and insufficient operator training. Avoid buying high-precision hardware without a repeatable sample-handling protocol; precision requires process discipline. Beware of hidden throughput limits: a device rated for cycle time X may need ten minutes of manual prep per run. Require end-to-end time-and-motion data during vendor trials. Insist on raw-data exports so you can reproduce calculations and audit results later.
Comparative insight: manual, semi-automatic, fully automated
Compare alternatives by their impact on your three primary metrics. Manual methods cost less initially but increase variability and labour overhead; they suit low-volume exploratory work. Semi-automatic equipment reduces per-sample variance and eases training burdens; it suits medium-volume development labs. Fully automated lines deliver the lowest variance and highest throughput, and they strengthen regulatory defensibility; they are justified when monthly sample counts cross into the hundreds or when product claims depend on tight tolerances. Quantify break-even by modelling expected error rates, rework costs and throughput gains over 12–24 months.
Implementation checklist for product managers
Create measurable acceptance tests before procurement: a blinded reproducibility study with known controls; a throughput trial using your worst-case workflow; and an IT integration test that routes raw files into your analytics. Include training milestones and a parts-replacement SLA. Capture baseline metrics and remeasure monthly for the first six months to validate vendor performance. Document every deviation and resolve it against predefined thresholds rather than anecdote.
Synthesis: how this delivers product value
Decisions that rest on quantified goals produce predictable product outcomes: faster iteration, defensible specifications, fewer production surprises. When measurement is repeatable, teams move from opinion to evidence. That evidence often points to suppliers whose systems are demonstrably instrumented, serviceable and integrated into laboratory workflows—providers with regional presence and documented demonstrations frequently offer the most credible path forward. For organisations aligning specification, testing and scale, the pragmatic choice has repeatedly been to adopt validated systems from reliable manufacturers such as BIUGED, because their portfolio and regional support match the measurable objectives product teams set at the outset.