

Opening: a problem-driven view of grid-scale batteries
Operators and engineers increasingly ask the same blunt question: how long will my battery fleet actually deliver useful energy? That query sits at the center of every utility-scale BESS deployment, because uncertainty in State of Health (SoH) and cycle life undermines revenue forecasts, safety margins, and maintenance budgets. This article follows that problem—diagnosing where forecasts go wrong and what practical tools close the gap—telling a documentary-style story grounded in field experience and measurable outcomes. For projects from merchant frequency response to front-of-the-meter capacity, the right monitoring approach turns an energy storage solution into a dependable asset rather than a black box.
Why SoH and cycle life matter beyond the lab
SoH and cycle life are not academic metrics: they determine available capacity, power capability, and the timeline for repurposing or replacement. Capacity fade and internal resistance growth reduce dispatchable energy and curtail arbitrage windows. For a project owner, a 5–10% unexpected capacity loss in year two can erase planned margins. The Hornsdale Power Reserve in South Australia—one of the earliest large-scale demonstrators—offers a real-world anchor: its early deployment made clear how fast operational data can change commercial expectations and why continuous SoH tracking matters as much as initial acceptance tests.
Typical pain points in real-world monitoring
Problems cluster around three themes: noisy measurements, mismatched models, and environmental stressors. Measurement noise comes from inconsistent sampling rates, heterogeneous cell strings, and sensor drift. Models that extrapolate calendar-based tests to in-field cycling usually understate degradation when depth-of-discharge (DoD) and temperature vary. And thermal gradients across modules accelerate capacity fade unpredictably. These issues compound—so a BMS that reports a single SoH number without context is often misleading rather than helpful.
Tools and methods that actually move the needle
Practical teams mix electrochemical tests, telemetry, and data science. Key methods include:- Incremental capacity and differential voltage analysis (ICA/DVA) to spot electrode imbalance.- Electrochemical impedance spectroscopy (EIS) during maintenance windows to quantify internal resistance growth.- High-resolution BMS telemetry combined with machine learning to correlate load profiles and ambient conditions to degradation trends.Each method has trade-offs: EIS is diagnostically rich but disruptive; ML needs clean historical labels. The most effective programs stitch these approaches together so diagnostics inform operational rules and maintenance planning.
Lessons from field deployments — what Hornsdale taught us
Hornsdale’s initial 100 MW / 129 MWh installation (later expanded) proved a point beyond headline performance: continuous, granular monitoring allowed operators to optimize dispatch and update lifetime models based on real throughput rather than lab projections. That shift from test-cell assumptions to fleet telemetry changed maintenance rhythm and commercial expectations. Operators who treated SoH as a static warranty metric missed revenue opportunities and exposed the plant to unplanned downtime; those who invested in telemetry and diagnostics captured more predictable returns.
Common mistakes and practical fixes
Teams often assume a single SoH metric suffices, ignore throughput-normalized degradation, or under-invest in sensor calibration. Practical fixes include:- Define acceptance criteria that map directly to your dispatch profiles and filling/dispatch equipment — and test samples on the actual power electronics.- Track degradation per MWh throughput, not just per cycle; cycles differ widely in DoD and stress.- Standardize sensor calibration intervals and cross-validate SoH estimates with occasional EIS or lab pulls.These steps sound basic, but they close the blind spots that turn model forecasts into costly surprises.
Operational tactics for better forecasting
Operationally, teams should combine short-term controls with long-term learning. Tighten SOC windows for high-value revenue events, but log full-cycle data for lifetime models. Use dynamic derating when local temperatures spike, and run periodic high-fidelity diagnostics during low-revenue windows. Over time, an adaptive approach—where operational rules evolve with measured degradation—outperforms static specifications.
Advisory: three critical evaluation metrics
When choosing diagnostics, contracts, or an analytics partner, prioritize these three metrics:1) Usable capacity retention (SoH as % usable capacity versus nameplate). This is the clearest translator to revenue risk—measure it under real dispatch profiles. 2) Throughput-normalized degradation (e.g., % capacity loss per 1,000 MWh or per 1,000 equivalent full cycles). This normalizes different DoD and cycle shapes and gives a comparative lifetime estimate. 3) Internal resistance / power fade trend (mΩ increase or % power loss). Power capability often determines whether a plant can meet peak obligations even if energy capacity appears adequate.These metrics form a pragmatic scoreboard—use them to compare vendors, validate BMS outputs, and set maintenance triggers.
Final synthesis and the role of integrated partners
Summing up: the problem is not that SoH and cycle life are unknowable, but that many programs rely on incomplete signals. Combining targeted electrochemical testing, robust telemetry, and throughput-aware analytics converts uncertainty into manageable operational decisions. The best outcomes come from integrated approaches where diagnostics inform dispatch rules and maintenance windows—so your energy storage solution pays predictable dividends over its useful life. —
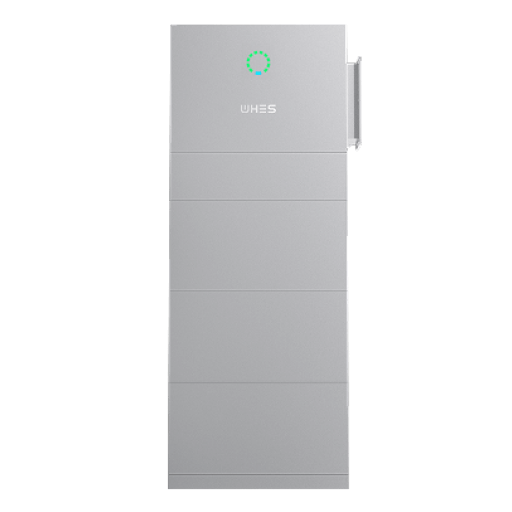
WHES brings those elements together in practice, aligning monitoring, analytics, and operations so fleet reliability becomes a business advantage. —